Demographic Data and Analysis
High quality demographic data and analysis
- Access powerful behavior and location-based data analysis tools to support your business or community decisions
- With a click, create powerful reports, compare areas, see change over time, or explore data driven projections
- Quickly locate, define and search your target area using filters or our radius analysis tool
- Partner with Social Explorer for a tailored service area analysis, community assessment, or demographic scan
Quickly and clearly search demographics by zip codes and see how behavior and location analysis interact
Comprehensive data | Demographics by zip codes
Accessing and understanding how to use data remains one of the biggest challenges specialists and non-specialists face. Thankfully, Social Explorer provides hundreds of thousands of data indicators across demography, economy, health, education, and more. You can now analyze and visualize socio-economic and demographic developments or search demographics by zip codes of almost any location in just a few minutes.
We also curate, organize and process every data point for accuracy and speed, and continuously add new data to our library, ensuring you always have up-to-date data variables available for your analyses.
Trusted sources | Accuracy you can count on
Base your business and service decisions on confident analytics through our trusted public and proprietary sources. Our data sources are reliable, complete, and endowed with quality. With years of data research and handling experience, we publish official documentation for each data resource in an organized and easy to read format.
Analysis tools | More time for decision-making
Measuring the dimensions and dynamics of place and population can consume your resources. Social Explorer makes analysis agile with point and click tools that provide answers to questions like; “How is this area changing?;” “What resources are within a 3-mile radius of my service area?;” and “What is the median household income in my area/region?.” Segment and visualize, compare two or more categories, and identify locations based on specific parameters with ease and uncanny accuracy.
Maps | A practical GIS interface
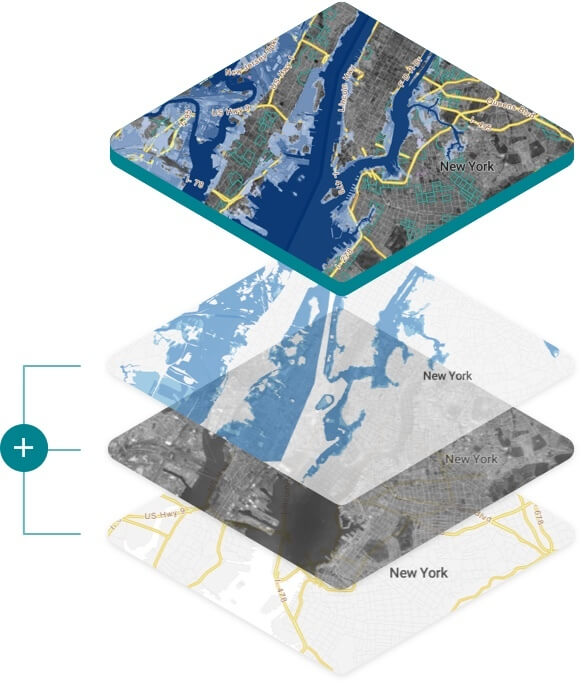
One of our most powerful analytic tools, this technology is science-based, trusted, and easily communicated. A simple click makes a thematic map and brings clarity and shape to your insights. Our unique metadata driven system does the rest automatically. Draw circles, polygons or lines, or create rings of any diameter around any point to select areas for examination and comparison. You can also merge your data with ours to increase the depth of your analysis.

Service Area and Community Needs Analysis
Learn the best ways to serve your community through our full-service scan of your service area or audience. Gain data-verified insights to understand the demographic and socioeconomic diversity distributed across your service area, and see what neighborhoods and demographics are in need of additional services and outreach.
Our services can be used by individuals within your organization through subscription, or you can partner with us to provide a bespoke analysis service. Social Explorer offers three tiers of analysis:
Service Area Demography — focused on the demographics of your service area. This service comes with a report and three-seat annual access to Social Explorer.
Audience/ Community Engagement Analysis — we combine your audience or community data with service area demographics. This service includes a report and five-seat annual access to Social Explorer.
Service Area Needs Analysis — covering environmental scan, demography, your audience/ community data, and a broader needs analysis. This service comes with a report and unlimited annual access to Social Explorer.
Trusted data sources
Social Explorer data come from trusted public and proprietary sources. With years of data research and handling experience, we curate and process every data point that goes into our system.

